
Your cart is empty
Browse OfferingsLicensed & Affiliated


Ethio Coffee Import and Export PLC is a family-owned Ethiopian coffee exporter shipping green coffee beans to roasters, importers, and distributors worldwide.
© 2026 Ethio Coffee Import and Export PLC. All rights reserved.
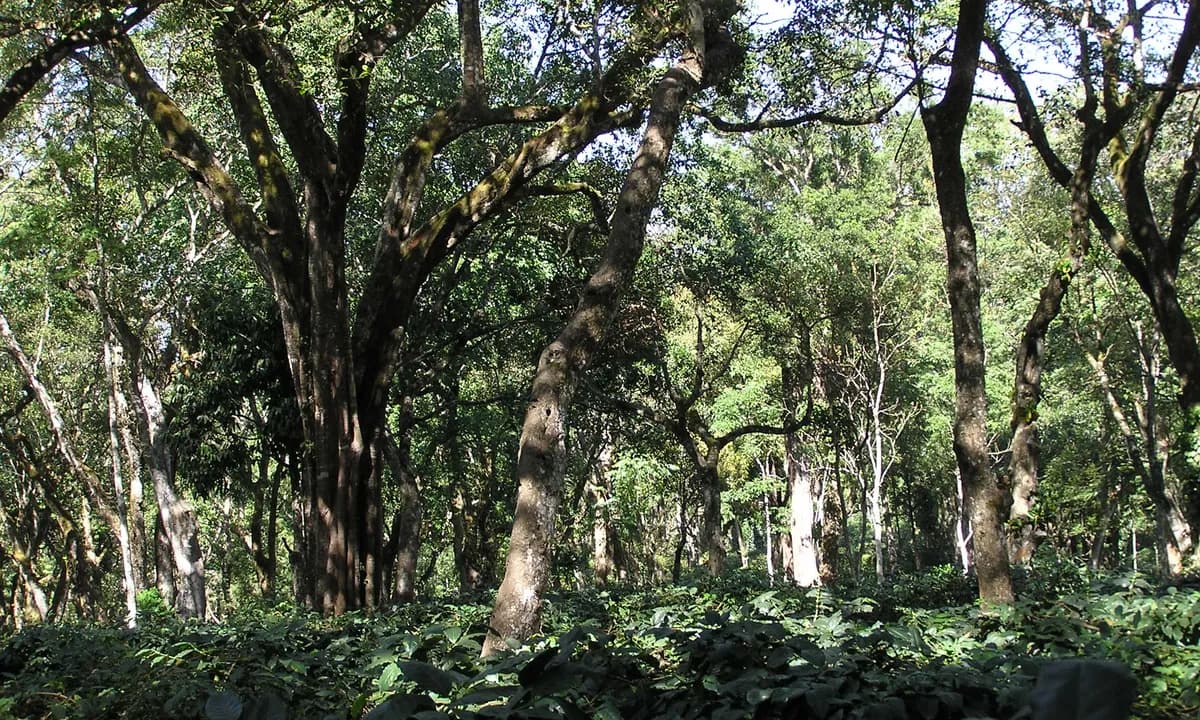
The Ethiopian coffee carbon footprint is dominated by the farm stage, like every origin, but Ethiopia's structure pulls that stage down: roughly 95% of the crop comes from smallholders using little or no synthetic fertilizer, most coffee grows under shade in forest, semi-forest, and garden systems, and drying is largely sun-powered. Published life-cycle work puts conventional Arabica at about 15.33 kg CO2e per kg of green coffee versus 3.51 kg for low-input, sea-freighted production (Nab & Maslin, 2020). For a buyer building Scope 3 inventory, the practical value of an Ethiopian lot is not a marketing claim but the primary data behind it: production system, fertilizer use, drying method, and sea-freight routing an origin exporter can document at the lot level.
The Ethiopian coffee carbon footprint has moved from a sustainability talking point to a line item in procurement. Roasters and importers inside the EU's reporting perimeter, and their suppliers further down the chain, now have to put a number on the emissions embedded in every kilo of green coffee they buy. That number lives in Scope 3, the indirect emissions category that for most coffee businesses is the largest and hardest part of the inventory. Green coffee sourcing sits right at its center.
This guide is written for the people signing those purchase orders, not for consumers counting the carbon in a single cup. It explains where a green coffee's footprint comes from, why Ethiopia's smallholder-and-shade production structure produces a genuinely different profile from intensively farmed origins, what the published per-kilo figures do and do not tell you, and how an origin-connected exporter can supply the lot-level primary data that a credible Scope 3 entry requires. Where a topic has its own dedicated resource, such as certifications or deforestation compliance, we link rather than repeat.
Most of a green coffee's carbon footprint is created before the beans ever leave the country. Life-cycle assessments consistently attribute the largest share of pre-roast emissions to the farm stage, driven by synthetic nitrogen fertilizer and the nitrous oxide it releases, followed by post-harvest processing and then transport. International shipping, the stage buyers instinctively worry about, is usually a small slice when coffee travels by sea rather than by air.
The clearest illustration comes from corporate inventories. The UK green trader DR Wakefield, in its 2021 carbon footprint disclosure, found that purchased goods, essentially coffee production at origin, accounted for about 54.8% of its total emissions, while all transportation combined came to just 1.33%. The lesson for a buyer is blunt: you cannot meaningfully cut a coffee program's footprint by optimizing freight. The decisive variables are set on the farm and at the mill, which is exactly where origin choice matters.
Scope 3 covers indirect emissions across a company's value chain that it does not own or directly control, including purchased goods like green coffee. For roasters it typically dwarfs Scope 1 (direct, such as roaster gas) and Scope 2 (purchased electricity), and green coffee is usually the single biggest Scope 3 category.
Three stages therefore decide most of the outcome. First, farm inputs, above all synthetic fertilizer, which generate field nitrous oxide emissions many times more potent than CO2. Second, processing and drying, where mechanical dryers and pumped water at industrial wet mills add energy load that sun-dried, gravity-fed stations avoid. Third, transport mode, where the gap between ocean freight and airfreight is enormous. An origin that farms with low inputs, dries in the sun, and ships by sea starts from a structurally lower base than one that does the opposite.
Ethiopia's coffee is produced in a way that happens to align with almost every low-carbon lever. Around 95% of the national crop comes from smallholders farming traditionally, with limited use of synthetic fertilizer and pesticide (USDA FAS and Ethiopian sector reporting). Most coffee grows under a tree canopy rather than in full-sun monoculture, spread across forest, semi-forest, garden, and a smaller share of plantation systems. And the overwhelming majority of the harvest is sun-dried on raised beds or patios, not machine-dried. None of this was engineered for a carbon report; it is how Ethiopian coffee has always been grown.
The single biggest structural advantage is low fertilizer intensity. Because farm-stage nitrous oxide from synthetic nitrogen is the largest driver of coffee's footprint, an origin where most farmers apply little or none avoids the emissions hotspot at its source. This is why so much Ethiopian coffee qualifies as organic-by-default, a point we cover in our guide to organic and Fairtrade certification. Industry analyses suggest switching a supply chain to organic can cut its Scope 3 footprint by up to roughly 75%, and Ethiopia's baseline already sits close to that low-input end.
Shade systems add a second, less obvious effect: carbon held in the trees and soil around the coffee. A 2024 study of coffee-based agroforestry in the Nono Sale Forest of southwestern Ethiopia measured total carbon storage of roughly 189 to 232 Mg per hectare across different shade strata, with Albizia-shaded plots holding the most (Ararsa & Endalamaw, 2024, International Journal of Environmental Protection and Policy). Standing carbon on the farm is not the same as a deduction from a green coffee's footprint, and buyers should not treat it as one, but it is real evidence that these systems function as carbon reservoirs rather than carbon sources, and it is the biodiversity story behind Ethiopia's EUDR compliance position.
From the exporter's side: when buyers ask us for emissions data, the first thing we can confirm is what is absent. At most of the washing stations and cooperatives we source from, farmers are not applying synthetic fertilizer at meaningful rates, and drying is done by sun on raised beds. The low number is not a program we sell; it is the default we can document.
There is no single official carbon number for Ethiopian green coffee, and any buyer told otherwise should be skeptical. What exists is a range from life-cycle studies, and the range itself is the useful part because it shows how much production method, not origin label, moves the result. The most cited comparison is Nab and Maslin's 2020 synthesis, which put conventional Arabica at about 15.33 kg CO2e per kg of exported green coffee against 3.51 kg for a low-input, sea-freighted, efficiently milled system, a reduction of roughly 77% (Nab & Maslin, 2020, Geo: Geography and Environment, UCL).
| Factor | Higher-footprint profile | Lower-footprint profile | Where most Ethiopian coffee sits |
|---|---|---|---|
| Fertilizer | Heavy synthetic nitrogen | Little to none / organic inputs | Low-input, often none |
| Farm system | Full-sun monoculture | Shade / agroforestry | Mostly shade-grown |
| Drying | Mechanical dryers | Sun on beds / patios | Predominantly sun-dried |
| Export transport | Airfreight | Ocean freight | Sea via Djibouti |
Read the table as a scorecard rather than a calculator. Ethiopian coffee lands on the low-footprint side of every row that a buyer actually cares about, which is why credible estimates for typical Ethiopian lots cluster toward the lower end of the published Arabica range rather than the conventional high figure. It also explains why the production stage, not shipping, is where the difference is won or lost. Broader syntheses attribute somewhere between roughly 75% and 91% of coffee's footprint to the production phase, so an origin that is structurally low-input at that phase carries the advantage through the whole chain.
Published per-kilo figures are averages from specific studies and geographies, not certified values for any given Ethiopian lot. Use them to understand the shape of the footprint and to prioritize data collection, not as a substitute for it. For a reportable Scope 3 entry, pair a defensible emission factor with lot-specific primary data on inputs, processing, and freight.
For companies in scope of EU sustainability reporting, green coffee emissions are not optional to disclose. Under the Corporate Sustainability Reporting Directive as revised by the 2025 Omnibus package, mandatory reporting now applies to companies with more than 1,000 employees and turnover above 450 million euros, and in-scope companies must still disclose total gross Scope 3 emissions broken down by significant category under the ESRS E1 climate standard (European Commission Omnibus package, 2025). The Omnibus trimmed the number of data points but kept Scope 3 in place. Larger roasters and importers are directly affected; their suppliers feel it through data requests flowing down the chain.
Reporting timelines shifted with the Omnibus "stop-the-clock" measure, moving many second-wave companies' first reports to 2028 covering financial year 2027. That is not a reason to wait. Building a reliable green coffee emissions inventory takes seasons of supplier data, and the companies that start collecting lot-level information from origin now will have primary data when reporting bites, rather than falling back on generic secondary averages that overstate a low-input origin like Ethiopia.
Default emission factors are often built on intensive, fertilizer-heavy production. Applied to an Ethiopian lot from a low-input smallholder system, they can materially overstate its true footprint. Primary data from origin, showing minimal synthetic inputs and sun drying, lets a buyer report a lower, more accurate figure and defend it. Under-counting is a compliance risk; over-counting is a competitiveness one.
This connects directly to work many buyers are already doing for deforestation rules. The geolocation and traceability records assembled for EUDR compliance, covered in our Ethiopian coffee traceability guide, are the same backbone that supports emissions accounting. A lot you can trace to a cooperative and a washing station is a lot whose production method, and therefore its footprint, you can actually characterize.
The most useful thing an exporter can give a carbon-conscious buyer is not a headline number but the underlying facts that feed one. A green coffee's emission profile is built from a handful of lot-level attributes, and each of them is something an origin-connected exporter observes directly rather than estimates from a desk. When a buyer asks us for Scope 3 support, this is the data we work from.
Whether a lot comes from forest, semi-forest, garden, or plantation coffee, and what fertilizer, if any, was applied. This drives the largest emissions category, the farm stage.
Washed, natural, or honey, and critically whether drying was sun-powered on raised beds or mechanical. Energy at the mill is a real, and reducible, contributor.
Cooperative, washing station, or farm-group identity, so the reported method is verifiable and tied to a specific lot rather than a national average.
Ocean routing from Djibouti and container details, so transport is modeled as sea freight, the correct low-impact assumption, not a generic blended factor.
None of this requires an exporter to claim farm ownership or to sell a carbon offset. It is documentation of how a specific lot was grown, processed, and shipped, handed to the buyer who needs it for their own inventory. Paired with an emission factor the buyer's sustainability team trusts, lot-level facts turn a vague "Ethiopian coffee is low-carbon" into a reportable, defensible entry. That is the difference between a marketing line and usable Scope 3 data.
Consider a mid-size German roaster processing about 400 tonnes of green coffee a year, large enough to sit inside CSRD scope and to face annual Scope 3 disclosure. Their sustainability lead has flagged that generic emission factors are inflating the reported footprint of their African coffees, and their largest customers, regional grocery chains, are starting to ask for supplier-level carbon data in tenders. The roaster does not need a carbon-neutral label; it needs accurate, lower numbers it can stand behind.
For this buyer, Ethiopian coffee is a practical lever rather than a slogan. Sourcing traceable lots from low-input smallholder cooperatives, with sun drying and documented sea freight, lets the sustainability team replace a punitive default factor with primary data that reflects the real production method. The same traceability file already built for EUDR does double duty for emissions. The commercial logic is clean: the roaster buys coffee it wanted anyway, for cup quality, and the sourcing decision also improves the Scope 3 line rather than worsening it.
A Japanese specialty importer buying five-container lots would approach the same origin differently, prioritizing micro-lot traceability over volume, but the underlying mechanism is identical: the lower footprint is unlocked by data, not by the country name on the bag. In both cases the exporter's job is to make the production method legible at the lot level. To see how those lots are documented from farm to vessel, our export process guide walks through the paperwork trail.
Ethio Coffee Import and Export PLC supplies traceable green coffee from Yirgacheffe, Sidamo, Guji, Harrar, Limu, and Jimma, with lot-level records of production system, processing, drying method, and sea-freight routing to support your Scope 3 and sustainability reporting. Request samples and the documentation behind them.
There is no single certified figure, but published Arabica life-cycle studies range from about 3.51 kg CO2e per kg for low-input, sea-freighted coffee to 15.33 kg for conventional intensive production (Nab & Maslin, 2020). Because most Ethiopian coffee is low-input, shade-grown, and sun-dried, typical lots sit toward the lower end. Use these as ranges, then pair them with lot-level primary data.
Structurally, it tends to. Roughly 95% of Ethiopia's crop comes from smallholders using little or no synthetic fertilizer, most grows under shade, and drying is largely sun-powered. Since farm-stage fertilizer is the biggest driver of coffee emissions, an origin that avoids it starts from a lower base than intensively farmed, full-sun, machine-dried coffee. The footprint still depends on the specific lot and method.
Yes, when backed by data. Green coffee is usually a roaster's largest Scope 3 category, and generic emission factors overstate low-input origins. Sourcing traceable Ethiopian lots with documented production system, drying method, and sea freight lets you replace a punitive default with accurate primary data, producing a lower, defensible figure under ESRS E1.
No, and buyers should avoid that claim. Ethiopian agroforestry stores substantial carbon, roughly 189 to 232 Mg per hectare in one 2024 southwestern Ethiopia study, and functions as a reservoir rather than a source. But standing farm carbon is not a direct deduction from a green coffee's product footprint, and treating it as an offset without a proper accounting method is not defensible in a Scope 3 inventory.
An origin-connected exporter can document the lot-level facts that feed an emission calculation: production system (forest, semi-forest, garden, plantation), fertilizer use, processing and drying method, traceability to cooperative or washing station, and ocean-freight routing. It supplies the inputs to your model rather than a finished carbon number, which is what a credible inventory needs.
About This Insight: Written by Ethio Coffee Import and Export PLC, an origin-connected Ethiopian coffee exporter with three decades of sourcing relationships across Yirgacheffe, Sidamo, Guji, Harar, Limu, and Jimma. Emissions figures draw on published life-cycle work by Nab & Maslin (UCL), agroforestry carbon research (Ararsa & Endalamaw, 2024), and sector data from the International Coffee Organization. Figures are study averages, not certified lot values; contact us for lot-level primary data.