
Your cart is empty
Browse OfferingsLicensed & Affiliated


Ethio Coffee Import and Export PLC is a family-owned Ethiopian coffee exporter shipping green coffee beans to roasters, importers, and distributors worldwide.
© 2026 Ethio Coffee Import and Export PLC. All rights reserved.
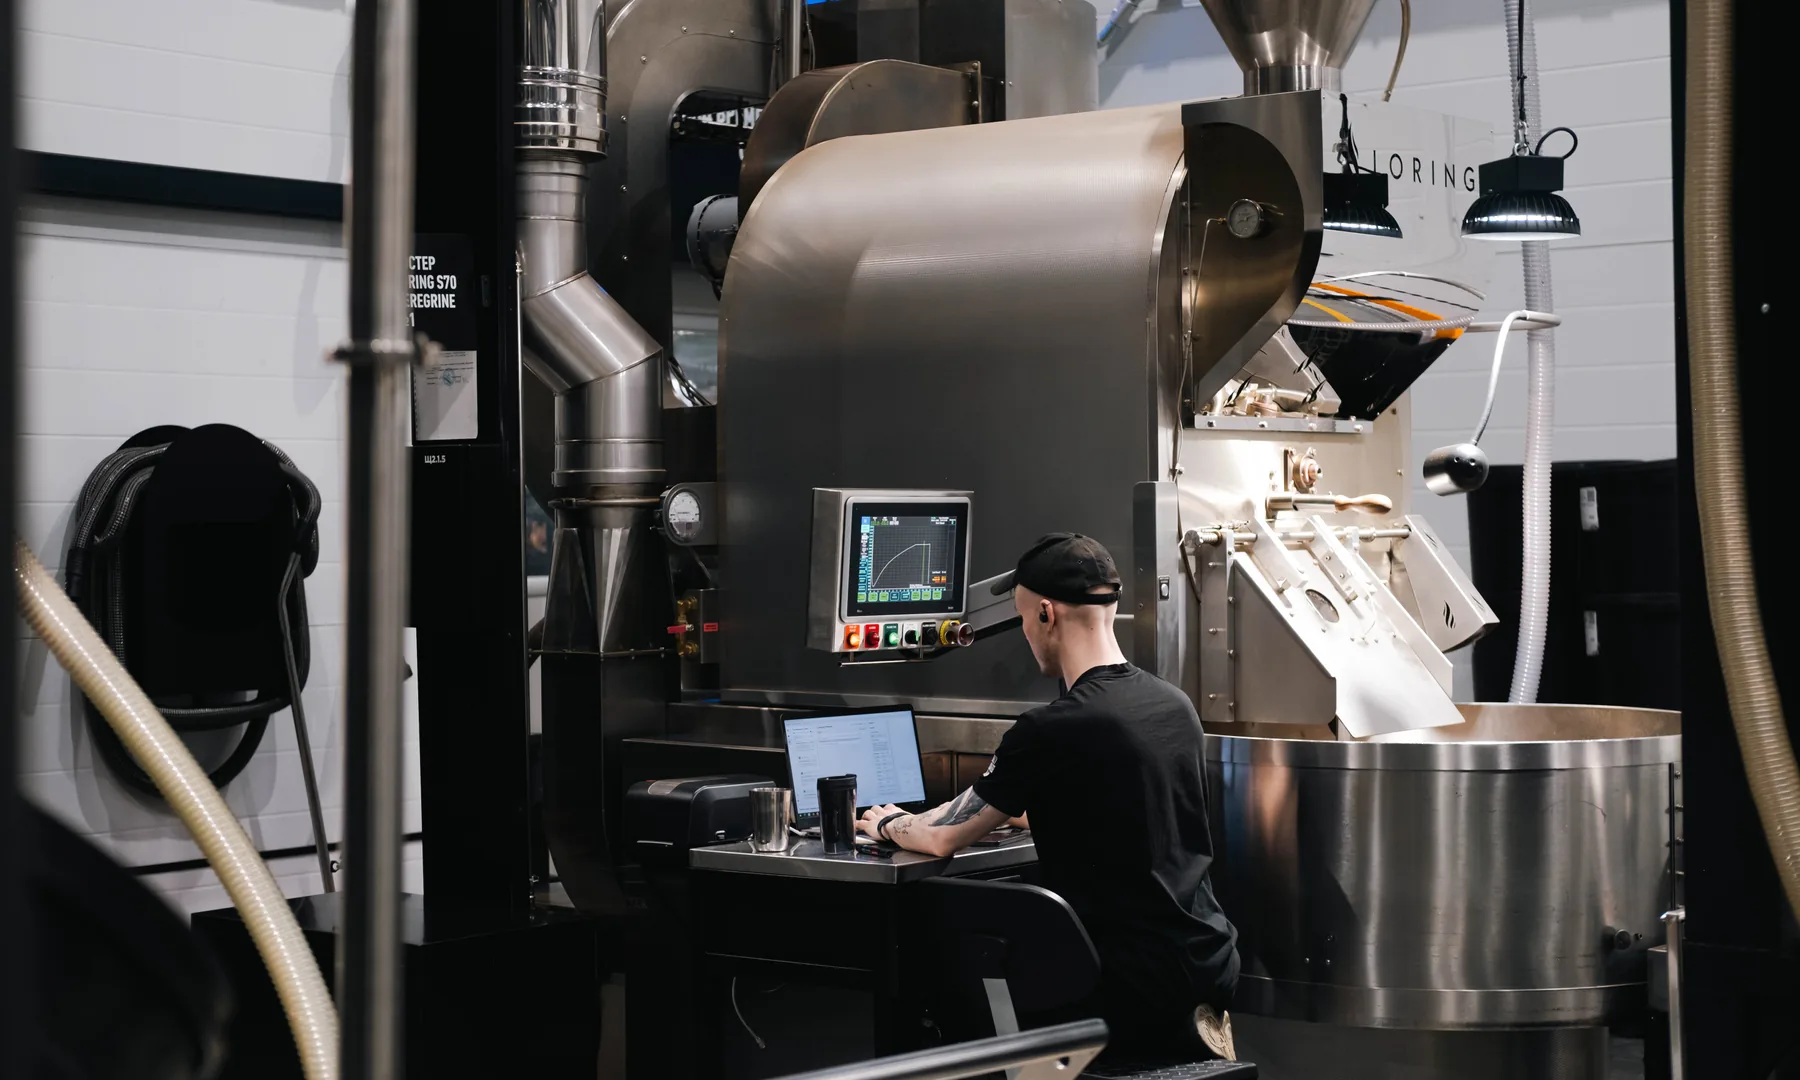
Coffee roasting weight loss is the green charge minus the cooled roasted output, divided by the green charge. Treat it as two connected controls: roast yield measures what leaves the roaster, while saleable yield subtracts QC pulls, handling loss, and packaging waste. Measure each profile consistently, build a baseline from repeated batches, and use actual yield to calculate finished cost and green-coffee purchasing needs.
Coffee roasting weight loss changes the cost of every finished bag. Pay for 1,000 kilograms of green coffee, lose 15 percent in roasting, and only 850 kilograms remain before cupping pulls, transfer spills, destoning, and packing loss. A cost model based only on the green purchase price understates the coffee cost of each saleable kilogram.
The percentage also helps production teams spot drift. A profile that normally returns 84.8 percent yield but suddenly returns 82.9 percent may have changed at the roaster, scale, lot, cooling tray, or measurement point. The number does not explain the cause by itself. It tells the team where to investigate.
Most online explanations stop after one formula. Commercial roasters need the next layer: a measurement standard, profile-specific baselines, a saleable-yield calculation, purchasing math, cost allocation, and an escalation rule. This guide puts those controls into one operating model.
Roast loss is the mass that leaves a green coffee batch during roasting. Water accounts for much of it, while chaff, carbon dioxide, and other volatile compounds contribute as the bean changes chemically. Roast yield describes the same batch from the opposite direction: it is the percentage of the green charge that remains as roasted coffee.
Roast loss % = (green charge - roasted output) / green charge × 100
Roast yield % = roasted output / green charge × 100
Suppose a roaster charges 60.00 kg and records 50.70 kg after cooling. The batch lost 9.30 kg. Roast loss is 15.50 percent, while roast yield is 84.50 percent. Both figures are correct; choose one reporting convention and use it across profiles, shifts, and reports.
Do not confuse roast yield with extraction yield. Roast yield is a production mass balance from green to roasted coffee. Extraction yield describes soluble material removed during brewing. They answer different questions and belong in separate records.
Controlled research supports the basic relationship between roast severity and mass loss. A 2025 study in the International Journal of Food Science and Technology reported progressively higher mass loss across its light, medium, city, French, and Italian roast conditions. Its exact results describe the tested coffee and protocol, not universal targets for every production roaster.
A useful percentage depends on two trustworthy weights. The arithmetic is simple; the operating discipline is not. A changing tote, incomplete cooling cycle, forgotten QC scoop, or inconsistent scale tare can create more apparent variation than the roast itself.
Cropster recommends collecting manual end weights for at least ten roasts of a profile before using the calculated average as expected loss. That is a practical starting rule for a new baseline. The Cropster weight-loss workflow then uses the expected percentage to estimate future end weight.
Measurement rule: record the roast output first, then remove QC samples. If a 500 g cupping pull is taken from one batch before weighing and after weighing from another, the roast-loss trend is no longer comparable.
There is no single normal percentage for every coffee and roast system. Barista Hustle describes an 11 to 24 percent broad range and notes that many light-to-medium specialty roasts fall between 11 and 16 percent. Its commercial roasting lesson on yield also explains why initial green moisture can shift weight loss even when roast degree is similar.
Treat published bands as orientation, not specifications. A measured baseline for the same lot, profile, roaster, batch size, and weighing method is more useful than a generic label such as light or medium. Roast color and sensory results still govern product acceptance.
Pair that yield baseline with a validated roast color measurement and batch release procedure, so an unstable color reading does not trigger an unnecessary production adjustment.
| Factor | How it can move measured loss | Control to record |
|---|---|---|
| Green moisture | More starting water can increase mass removed at a similar endpoint | Lot moisture, method, and test date |
| Roast endpoint | Greater roast severity generally removes more water and dry matter | Color, drop conditions, time, and sensory target |
| Batch and machine | Heat transfer, airflow, and residence time change with equipment and loading | Roaster ID, charge mass, and profile version |
| Recovery and weighing | Retained beans, hot weighing, spills, and tare errors distort the result | Scale ID, container, cooling endpoint, and exception note |
Buyers can reduce one source of uncertainty by sending current condition data with each lot. Pair production records with a controlled green coffee moisture and water activity check. Density, screen distribution, and processing information can help explain behavior, but none should be converted into a roast-loss promise before production trials.
Roast yield ends at the scale after cooling. Saleable yield continues to the sealed finished product. The distinction prevents production teams from blaming the roast for losses that occur during destoning, transfer, QC, blending, grinding, or packing.
Record coffee collected during destoning separately from foreign material so a lower reject weight is not mistaken for better process control. Use the coffee destoner reject log and batch-release protocol to preserve that distinction alongside your yield figures.
Roast yield = cooled roasted output / green charge
Saleable yield = packed conforming coffee / green charge
Consider a 60.00 kg charge that returns 50.70 kg roasted. The team takes 0.30 kg for QC and retention, loses 0.15 kg in transfer and destoning, and records 0.25 kg of packing overfill and residue. Packed conforming output is 50.00 kg. Roast yield is 84.50 percent, while saleable yield is 83.33 percent.
| Mass balance | Kilograms | Owner |
|---|---|---|
| Green charge | 60.00 | Roasting |
| Cooled roasted output | 50.70 | Roasting |
| QC and retention pulls | 0.30 | Quality |
| Transfer and destoning loss | 0.15 | Production |
| Packing variance | 0.25 | Packaging |
| Packed conforming coffee | 50.00 | Finished goods |
This mass balance gives each team a controllable measure. Roasting owns green-to-cooled yield. Quality owns planned sample quantities. Production owns recovery. Packaging owns fill control and finished count. Finance receives one saleable output number that reconciles to physical inventory.
Divide the landed green cost by the yield expressed as a decimal. If green coffee lands at CAD 10.00 per kilogram and roast yield is 84.5 percent, the green input cost is CAD 11.83 per roasted kilogram. Using the 83.33 percent saleable yield raises green input cost to CAD 12.00 per packed kilogram.
Green cost per roasted kg = landed green cost per kg / roast yield
Green cost per saleable kg = landed green cost per kg / saleable yield
| Saleable yield | Green cost at CAD 10/kg | Green needed for 1,000 saleable kg |
|---|---|---|
| 86% | CAD 11.63/kg | 1,162.8 kg |
| 84% | CAD 11.90/kg | 1,190.5 kg |
| 82% | CAD 12.20/kg | 1,219.5 kg |
| 80% | CAD 12.50/kg | 1,250.0 kg |
The table isolates green coffee only. A full finished-goods cost still adds roasting labor, energy, maintenance, quality control, packaging, freight to the customer, and any allocated overhead. Use the Ethiopian coffee landed cost framework to establish the correct starting cost before applying yield.
One percentage point matters at scale. At 100,000 saleable kilograms and CAD 10 per green kilogram, an 84 percent model requires about 1,191 tonnes of green coffee. An 83 percent realized yield requires about 1,205 tonnes, roughly 14 additional tonnes. The business should not force roasting darker or lighter to chase yield; it should price, purchase, and schedule from the product's approved sensory profile and measured output.
Production planning works backward from required saleable output. Divide the finished requirement by expected saleable yield, then divide the green requirement by the validated charge size. Round batches up and carry the expected remainder into the next schedule rather than hiding it as waste.
A wholesale order needs 2,000 kg packed. The profile's rolling saleable yield is 83.6 percent. Green requirement is 2,392.3 kg. On a validated 60 kg charge, the schedule needs 40 batches, providing 2,400 kg green input and approximately 2,006 kg expected packed output. The six-kilogram buffer is visible and intentional.
Keep yield connected to the lot record. The green coffee inventory management workflow explains how to track coverage, allocation, and run-out dates. Adding actual saleable yield turns a nominal stock position into a more reliable finished-goods forecast.
Investigate a change in a fixed order. Confirm the measurement system first, then the green coffee, roast execution, and downstream recovery. Editing a profile before checking the scale can create a real roast problem in response to a false signal.
| Check | Evidence to review | Possible response |
|---|---|---|
| 1. Weighing | Tare, calibration check, container, timing, missing beans | Correct and remeasure the workflow |
| 2. Identity | Lot, profile version, roaster, batch size, operator | Reclassify the record or isolate the wrong input |
| 3. Green condition | Moisture, storage history, density, screen distribution | Retest the lot and brief production |
| 4. Roast execution | Color, drop point, time, airflow, gas, curve deviation | Review execution against sensory results |
| 5. Recovery | Cooling tray, cyclone, destoner, transfer, QC pulls | Repair leakage or correct the mass balance |
Set an internal investigation limit from historical process variation. Start with ten or more comparable batches, then review the mean, range, and sensory acceptance. A team can flag values outside its normal band without declaring them defective. The final decision must still consider roast color, cup result, and whether the measurement was valid.
Ethiopian lots can change between crop years even when the origin and product name stay the same. Pass current moisture and physical data from QC to roasting, then validate the first production batches. The green coffee density protocol shows how to create a method-controlled physical record without turning density into an unsupported quality grade.
A weekly review should be short enough to continue when production is busy. Use one report by lot and profile, with both roast yield and saleable yield. Separate planned QC pulls from unplanned loss, and retain the raw weights so the percentage can be audited.
Add a monthly reconciliation between green inventory issued, roasted output, packed finished goods, samples, and documented waste. That review catches scale offsets, unrecorded transfers, overfill, and master-data errors that a roast report cannot see. It also gives procurement a better demand signal for the next Ethiopian allocation.
Coffee roasting weight loss becomes commercially useful when it connects sensory approval to physical output. Measure the green charge and cooled batch consistently, build profile-level baselines, separate roast yield from saleable yield, and apply the realized percentage to cost and purchasing. The result is better production control without asking the roast team to compromise flavor for a headline yield number.
Share your cup target, product format, annual volume, and production needs. We can prepare current Ethiopian lot options, samples, pricing, and physical data for your buying and roasting teams.
Subtract the cooled roasted output from the actual green charge. Divide that difference by the green charge, then multiply by 100. A 60 kg charge that returns 50.7 kg lost 9.3 kg, so roast loss is 15.5 percent. Record both weights before removing any QC samples.
Published guidance places coffee roasting weight loss in a broad range, with many light-to-medium specialty profiles around 11 to 16 percent. Darker conditions can lose more. Green moisture, roast endpoint, batch size, equipment, and weighing method all matter, so a profile's measured history is the better operating benchmark.
Divide one kilogram by the expected yield. At 85 percent roast yield, 1 kg of roasted coffee requires about 1.176 kg of green coffee. For production and purchasing, use saleable yield instead. An 83 percent saleable yield requires about 1.205 kg green for each packed kilogram.
Yes. Higher initial moisture can increase the mass removed before a similar roast endpoint. Moisture is not the only driver; heat transfer, profile, batch size, and recovery also affect the result. Record current lot moisture beside weight loss so teams do not interpret every change as a roast execution problem.
No. Roast loss is a consistency and mass-balance signal, not a stand-alone quality score. Use it with roast color, curve data, physical observations, and sensory evaluation. A batch can hit the expected percentage and still taste wrong, while a valid lot change may shift weight loss without reducing cup quality.
About This Insight: Published on Aug 17, 2026 by Ethio Coffee Import and Export PLC, an origin-connected Ethiopian coffee exporter with three decades of sourcing heritage across trusted cooperatives, washing stations, and farming communities. Contact us for current lot information and production-specific data.